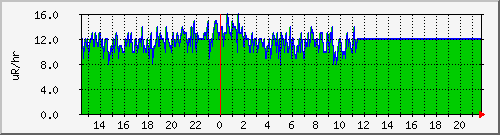
| Max Aware RM-60 | 16.0 uR/hr | Average Aware RM-60 | 11.0 uR/hr | Current Aware RM-60 | 12.0 uR/hr | ||
| Max Aware RM-60 | 16.0 uR/hr | Average Aware RM-60 | 11.0 uR/hr | Current Aware RM-60 | 12.0 uR/hr |
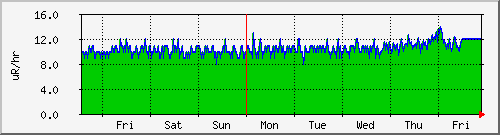
| Max Aware RM-60 | 14.0 uR/hr | Average Aware RM-60 | 10.0 uR/hr | Current Aware RM-60 | 12.0 uR/hr | ||
| Max Aware RM-60 | 14.0 uR/hr | Average Aware RM-60 | 10.0 uR/hr | Current Aware RM-60 | 12.0 uR/hr |
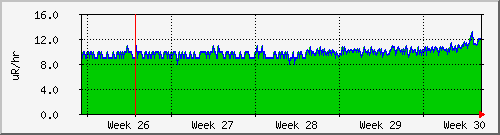
| Max Aware RM-60 | 13.0 uR/hr | Average Aware RM-60 | 9.0 uR/hr | Current Aware RM-60 | 12.0 uR/hr | ||
| Max Aware RM-60 | 13.0 uR/hr | Average Aware RM-60 | 9.0 uR/hr | Current Aware RM-60 | 12.0 uR/hr |
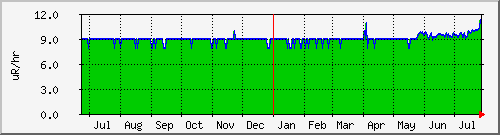
| Max Aware RM-60 | 11.0 uR/hr | Average Aware RM-60 | 9.0 uR/hr | Current Aware RM-60 | 11.0 uR/hr | ||
| Max Aware RM-60 | 11.0 uR/hr | Average Aware RM-60 | 9.0 uR/hr | Current Aware RM-60 | 11.0 uR/hr |
| GREEN ### | Incoming Traffic in Bytes per Second |
| BLUE ### | Outgoing Traffic in Bytes per Second |
| version 2.9.6 | Tobias Oetiker <oetiker@ee.ethz.ch> and Dave Rand <dlr@bungi.com> |